Asset Class Assessments and Expected Rates Of Return
Prices of financial assets embody and convey investors’ and traders’ expectations for future rates of return. This is referred to as market-based expected rates of return.
Common stocks ultimately derive their value from corporate earnings. Preferred stocks derive their value from dividends, which are paid from corporate profits before common stock dividends are paid. Fixed income securities derive their value from interest payments.
Therefore, the relationship between corporate earnings and prevailing prices of common stocks, or the earnings/price ratio, is a measure of their market-based expected future rates of return. Similarly, prevailing dividend yields on preferred stocks are a measure of their market-based expected rates of return. For fixed income assets, their prevailing yields to maturity measure their market-based expected rates of return. These market-based expected rates of return go far beyond just being useful, they are necessary measures for assessing the investment attractiveness of major financial asset classes.
Two important applications for market-based expected rates of return on major financial asset classes are provided in the tabs below. The first application, Asset Allocation Assessments, identifies key measures for the additional rate of return that markets expect and require from an asset class in relation to expected returns on benchmark U.S. Treasury securities. This information is used to make asset allocations decisions in portfolios.
The second application, Longer-Term Expected Future Rates of Return, provides market-based expected returns on major asset classes over longer time periods. These are required inputs for financial and retirement planning. Most financial planners and wealth management advisors use past rates of return on major asset classes to project future rates of return and values of clients’ portfolios. This is an inferior and sometimes misleading approach. The reason is that past rates of return on asset classes do not measure market-based expected rates of return. Using past rates of return just assumes that future rates of return will be similar to past rates of return. There is little empirical evidence to support that assumption. There is empirical evidence that expected market-based expected future rates of return are better predictors of future rates of return.
Asset Allocation Assessments
Unless you are a truly exceptional investor, which very few are, your portfolio is unlikely to outperform, and more likely to underperform benchmarks based on diversified major indices. The empirical evidence of this is vast and conclusive. Those investors, who are informed and wise, will diversify their investment portfolios among several major financial asset classes. This means that asset allocation will, by far, be the largest determinant of how diversified portfolios perform. This is also confirmed by historical data.
If you have a diversified investment portfolio, then the investment process requires that you measure market expectations for future rates of return on major asset classes. If those market-based expected and required rates of return are assessed to be attractive in the prevailing investment environment, then owning more of that asset class makes sense. If expected and required rates of return are unattractive in the prevailing environment, then owning less of those asset classes makes sense. As Warren Buffett has said, “investing is simple, it just not easy.”
Regardless of one’s assessment of the investment environment, market-based expected and required rates of return are needed. The reason that market data are used is that we need to measure what markets expect and require, and that is reflected in market prices. This is the simple part of the investment process, but it is seldom done.
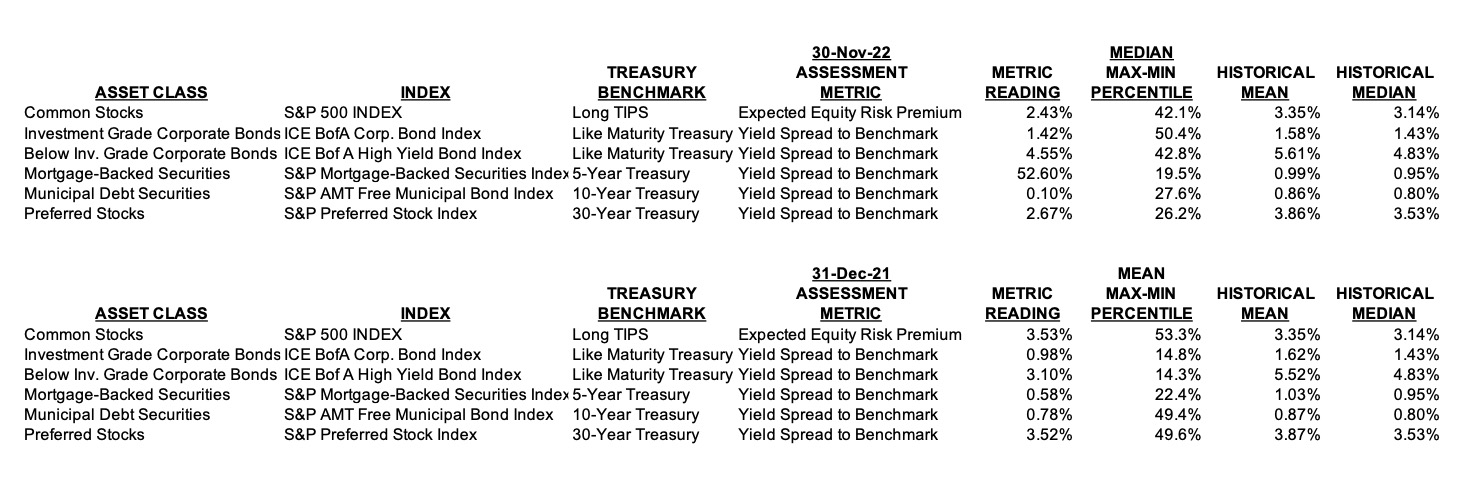
For common stocks, the ratio of earnings to price measures market expectations for future real rates of return. For major fixed income classes and preferred stocks, yields to maturity measure market expectations for future rates of return. Also and equally important, investors assess asset classes in relation to other asset classes. Each asset class is not assessed in isolation from other asset classes. These relative comparisons are facilitated by comparing an asset class to a risk-free benchmark asset. In practice, U.S. Treasury securities are used as risk-free assets. Expected risk premiums on common stocks and yield spreads on fixed income asset classes and preferred stocks are the key metrics needed make comparisons among riskier asset classes.
The following table provides recent information on common stocks, preferred stocks, and four major U.S fixed income assets. Information includes the index used to represent each asset class, its benchmark risk-free Treasury security, and the metric used to measure its expected return difference to its Treasury benchmark. The column headed Max-Min Percentile measures where the current equity premium or yield spread falls within its historical maximum and minimum, centered on the historical median. A Max-Min Percentile of 50 is the historical median. The historical maximum is assigned a Max-Min Percentile of 100, and the historical minimum is assigned a Max-Min Percentile of zero. As a generalization and based on the prevailing investment environment higher readings above the median of 50 indicate that an asset class is more attractive. Lower and below 50 readings indicate and asset class is unattractive.
DOWNLOAD
Longer-Term Expected Future Rates of Return
Investors also need to have some reasonable expectations for what rates of return they can expect from various major asset classes and from portfolios comprised of them over longer time periods. Again, it is important that investors use expected rates of return that are based on known market information, that is, market-based expected returns. Unfortunately, few use this approach, and instead use past rates of return or expert views and opinions of wealth managers and investment advisors.
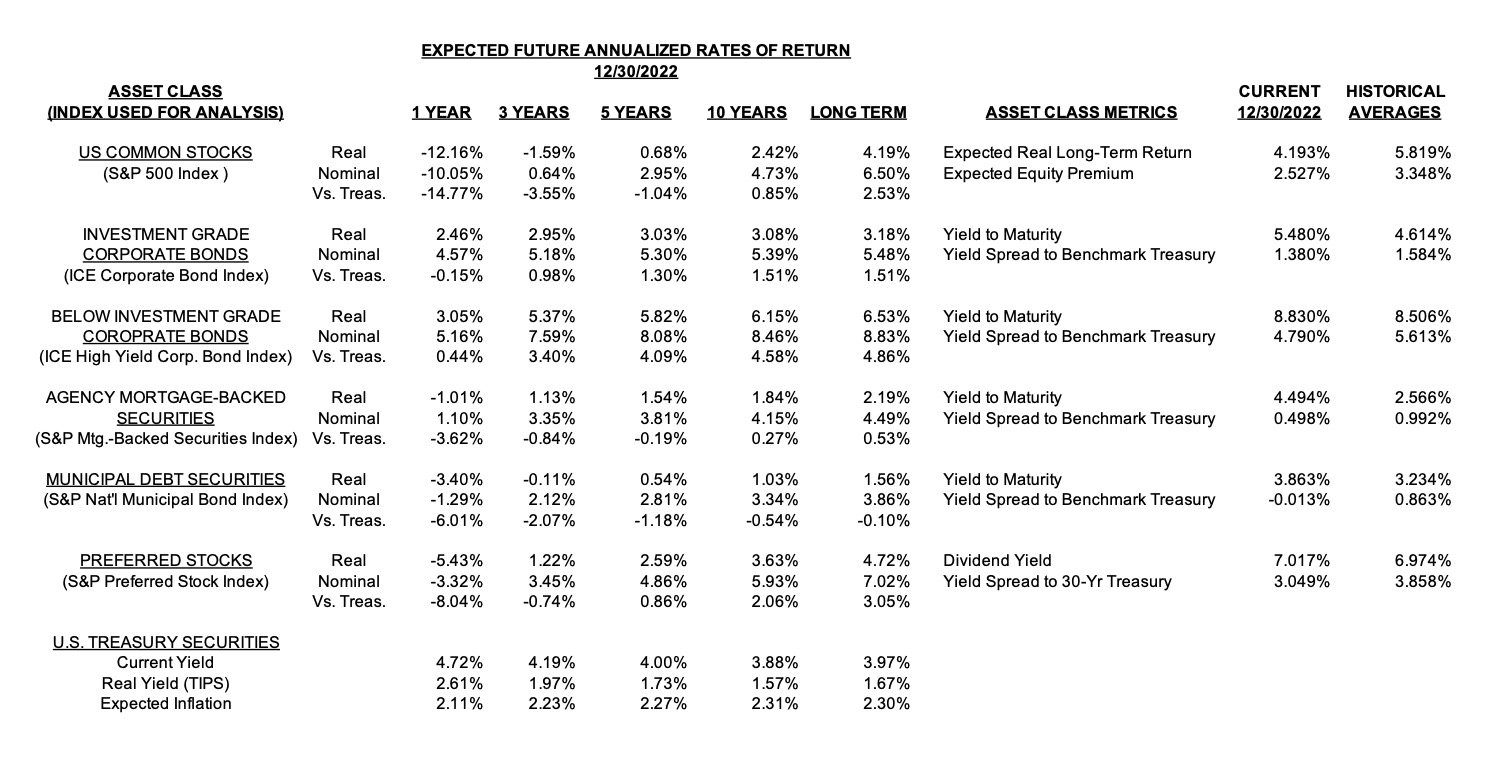
The following table provides this information for the same six financial asset classes covered in the prior tables and for U.S. Treasury securities of various maturities. Expected rates of return for Treasuries are their current yields to maturity. If held to maturity, the current yield to maturity is the future total expected rate of return. Real yields on Treasuries are based on TIPS yields, and market-based expectations for inflation are the difference between nominal and real yields on Treasuries.
Expected future rates of return on the six riskier financial asset classes are rule-based. Specifically, the risk component of their expected return is assumed to revert to historical average levels over each time period. While expected 1-year rates of return are included, they are less important for long-term investors. Also, an assumption that risk metrics will revert to average levels in one year is often unrealistic. The focus should be on periods of at least three years and even better for longer time periods. For financial planning purposes, using a 10-yr period and long-term expected rates of return is advised.
Within 1-5 year time periods, Common and Preferred Stocks expected future annualized rates of return are inferior to risk-free U.S. Treasury Securities. Common Stock expected future annualized rate of return is a modest 2.42% in 10 years. Fixed Income asset classes expected future annualized rates of return are positive, but below historical averages, compared to Treasury Securities in 1-10 year time periods. In 1-5 year time periods Investment Grade and High Yield fixed income asset classes offer positive nominal returns, compared to current U.S. Treasury yields. U.S. Treasury Securities, particularly 1-3 Year 4.50%, are competitive and attractive with all stock and fixed income riskier asset classes.

