FIXED INCOME DECISION CRITERIA
The fixed-income asset class is a risk-free (Treasuries) or lower-risk (credit-rated bonds) financial asset class compared to equity (stock) financial assets. A bond (fixed-income) issuer borrows from the lender (investor) and guarantees return of principal (face value) at a certain maturity or call date, along with periodic payments of interest until maturity or call. Indentures (bonds) and loan terms specify the obligated terms that the issuer guarantees.
Credit risk is a measurement of the issuer’s ability (credit rating) to meet their obligation. Generally ranked AAA-CCC, best to worse, U.S. Treasuries achieve the highest AAA rating and are considered risk-free for their ability to meet their obligation. Investment Grade rating, generally AAA to BBB, are issuers other than the U.S. Treasury which are not risk-free, but have rated degrees of capability to meet their obligations. High Yield (junk) rating, generally BB to C-, are issuers which have lower-rated degrees of capability to meet their obligations.
When placed (issued) on the publicly-traded bond markets, they are fixed-income securities, often with credit ratings, and exchanged at market prices daily. They are also contained in indexes which accumulate many bonds with specified maturity and credit factors into an indexes.
Duration risk is a measurement of a bond (or index) change in value due to changes in interest rate levels (up or down) over time. Current interest rates at given maturity and credit risk are called yield. The market price of a bond is set to the yield which the market demands from bonds depending on currently prevailing interest rates (which may be different from the issuer’s initial interest rate). The longer maturity of a bond (or a bond index), the greater the change of market value of the bond when the yield to maturity demanded by the market changes. If current market yields are higher than bond-issue interest rates, the bond price will decline to reach the current market yield to maturity. If current market yields are lower than bond-issue interest rates, the bond price will increase to reach the current market yield to maturity.
The current yield to maturity (YTM) is the exact, market based expected return of a particular bond or index. Yield is always stated in nominal terms, exact total rate of yield on top of the maturity value (including the decline or increase from purchase price dependent on trading premium or discount price). The value of the yield which investors receive is increased or decreased by the amount of actual inflation over the investor holding period. The yield which the investor receives over the holding period, less the realized inflation over the holding period, is called the real yield. It is real because the value of the interest yield is decreased by the increase of prices (inflation) which decrease the economic value (real value) interest received.
Long Treasury Bond Nominal Yield/Inflation Comparison
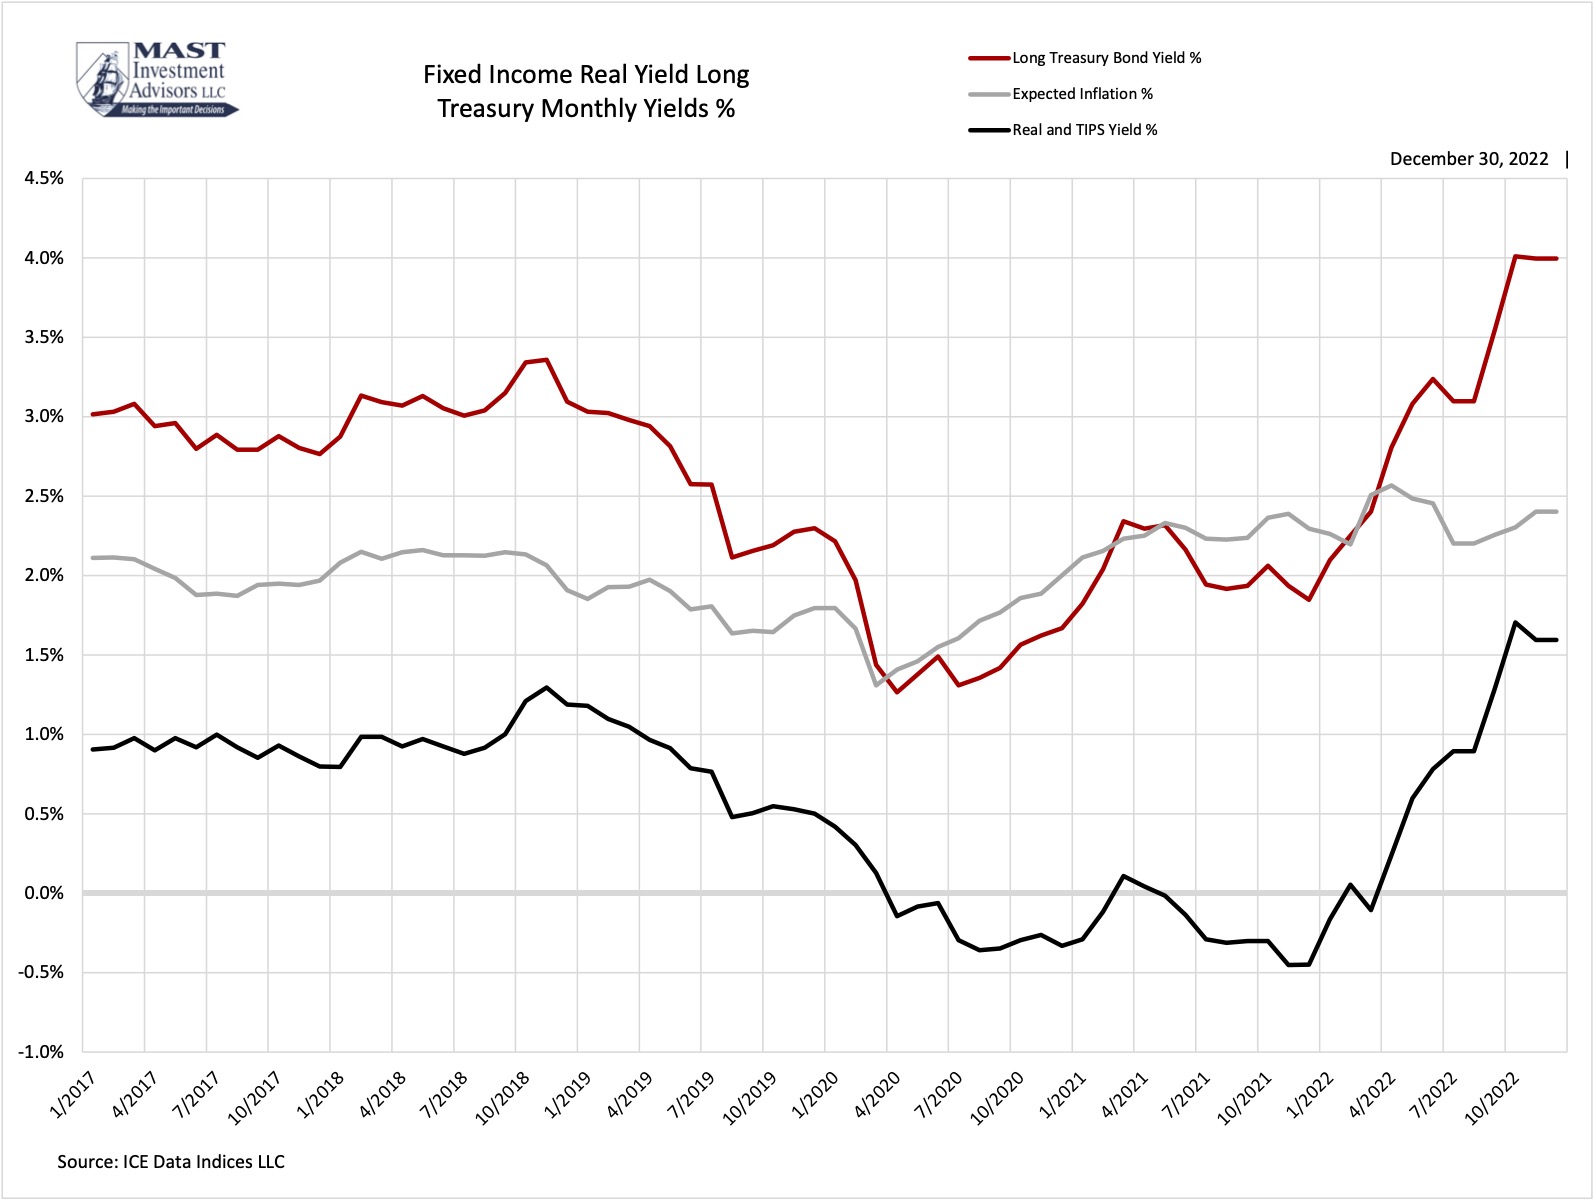
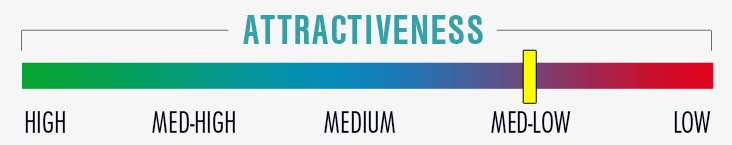
Treasury Real Yield Investing is a long-term process which should be measured by long-term results. Because equities are long-term investments, Mast uses the long (30-year) Treasury bond as the risk-free benchmark compared to equity investment returns. The long TIPS (Treasury inflation protection) bond is the market based, real (long Treasury nominal bond yield less expected inflation) long-term risk-free rate of return. The first graph displays the components of these factors, the resulting long-term risk-free expected return, and the attractiveness of that expected return.
The long Treasury bond, 30 years maturity, is the long-term, risk-free guaranteed nominal rate of return. The yield to maturity changes daily in public markets as the price of the bond changes every day to the exact yield-return which the market requires. This market yield is a nominal yield which is the % return paid periodically until maturity on the price of the bond.
The spending power, or the net-worth, of the interest payments (yield) are reduced by the amount of inflation over the term (maturity) of the bond. It is important to compare the market-based yield of the long Treasury bond with the market-based expected inflation rate over the same time term. The difference between the nominal yield and the expected rate of inflation is the real yield. It is more accurate, and comparable, to measure the differences of real return among asset classes. It is also more important to use market expectations to measure expected returns and expected inflation.
The Treasury real yield graph displays monthly average long Treasury nominal yields for the past five years, expected rates of inflation and the long Treasury TIPS yield.
Week 12/30/22
Long Treasury Bond
Current Inflation CPI
Expected Inflation
Yield %
3.97%
8.06%
2.30%
Historical Median Yield %
5.65%
2.94%
2.79%
Current inflation is substantially higher than historical average. Long Treasury bond yield is substantially below historical average. Long terrm expected inflation is subtantially lower than current inflation, market expects inflation to decline over time. These inflation rates reduce real expected returns for all assets: risk-free Treasury bonds, fixed-income bonds, and risk (equities) assets.
Long Maturity TIPS Yield
The decision for allocation and selection of fixed income investments begins with U.S. Treasuries. They are the risk-free, guaranteed yield return for different periods of time (maturity). The attractiveness of the guaranteed yield depends on alternative, riskier fixed-income yields (spreads) and alternative riskier equity expected returns (risk premium). Attractiveness of the different fixed-income yields also depend on 1) current yields compared to historical yields 2) current spreads compared to historical spreads 3) current trading ranges and trends of yields and spreads. The TIPS (real) yield is the benchmark for these comparisons. It is also the first criteria to ascertain the attractiveness of the entire fixed-income financial asset class.
Treasury Inflation Protected Securities, or TIPS, provide investors with a way to protect their investment from the impact of inflation. This protection is accomplished by linking interest paid and the principal returned to investors at maturity on TIPS to the Consumer Price Index. Yields on TIPS are real yields, that is, they are adjusted for inflation. As with all securities issued by the U.S. Treasury, TIPS effectively have no credit risk. TIPS are issued with maturities of 5, 10, and 30 years.
The long Treasury Inflation Protection (TIP) bond provides a payment equal to the CPI (inflation) rate as an increase in the principal maturity value. It also provides a stated interest coupon rate. Depending on the current market price of the bond, the TIP yield is the real yield of the bond because the inflation payment is reflected in the principal value. Because the adjusted principal and coupon rate are guaranteed by the U.S. Treasury, the TIP yield is the long-term, real, risk-free expected return. It is market-based and valued in market transactions daily. Among investment alternatives, investors who require complete safety (risk-free) real rate of return for the long-term can invest in this security. To achieve higher rates of return generally involves the assumption of higher levels of risk. The TIP yield is a critical benchmark to measure relative risk and return opportunity and against which to compare rates of return of riskier investments. Comparison of the TIP yield to 1) past yield levels and 2) current trending yield levels provide insight into prevailing economic conditions, trends and influence on riskier asset relative returns.
The assessment of other, riskier financial assets compares their expected rates of return to those on risk-free assets. This comparison is known as the risk premium. U.S. Treasuries are the largest and most liquid risk-free asset class. Yields on long maturity (30-year) TIPS are used to assess U.S. stocks. Subtracting the long-TIPS yield from the expected real rate of return on the S&P 500 results in an estimate of the expected equity risk premium. This is a critical measure used to assess the relative attractiveness of U.S. stocks to long maturity U.S. Treasury securities.
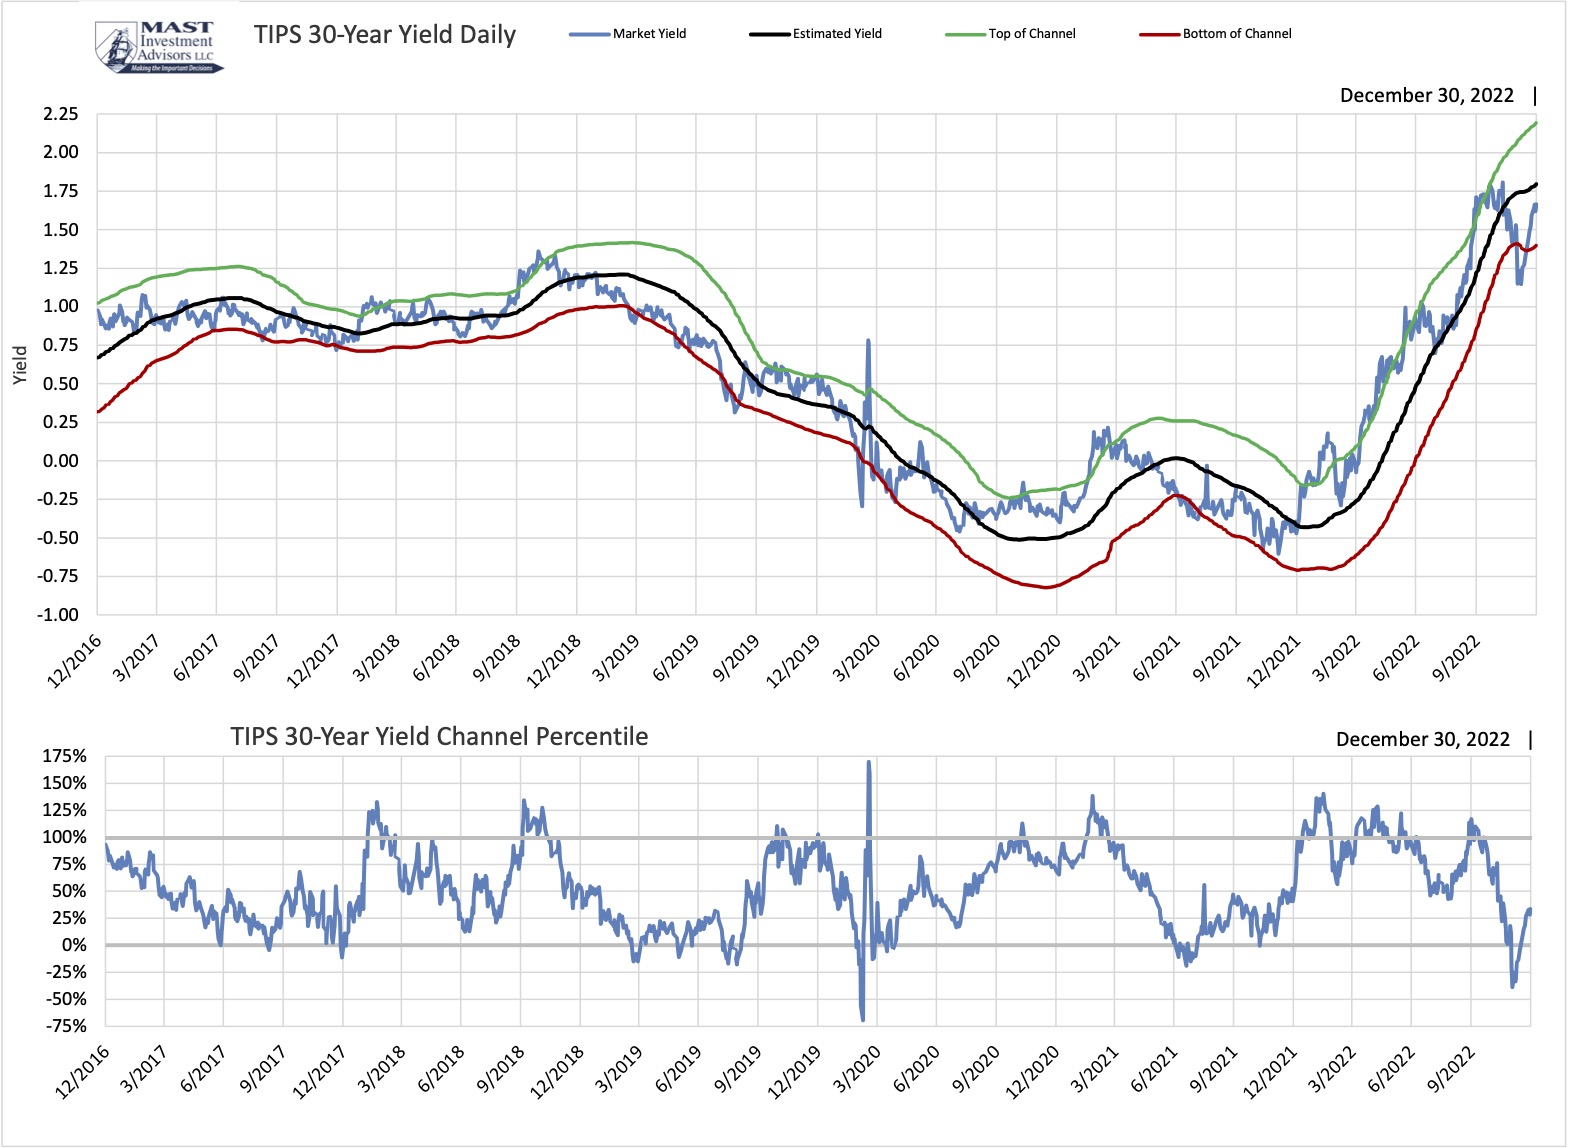
The accompanying chart provides yields on long maturity TIPS over the past five years. Also provided are estimates of trend levels of those yields and the variability of yields around the estimated trend. This information is used to assess where long TIPS yields might be heading. This historical yield information, trading range and trend contribute to the assessment of the attractiveness of this risk-free investment.
Week
12/30/22
Current % Yield
1.666%
Estimated % Yield
1.796%
Channel Percentile
33.7%
Trend
Rising Faster
Long TIPS yield is high in its channel and rising faster. The rising real yield is caused by ongoing and expected increases in Fed Funds rate, passing thru to short term rates primarily and also to longer term rates.
S&P 500 Index Dividend Yield / TIPS Yield Comparison
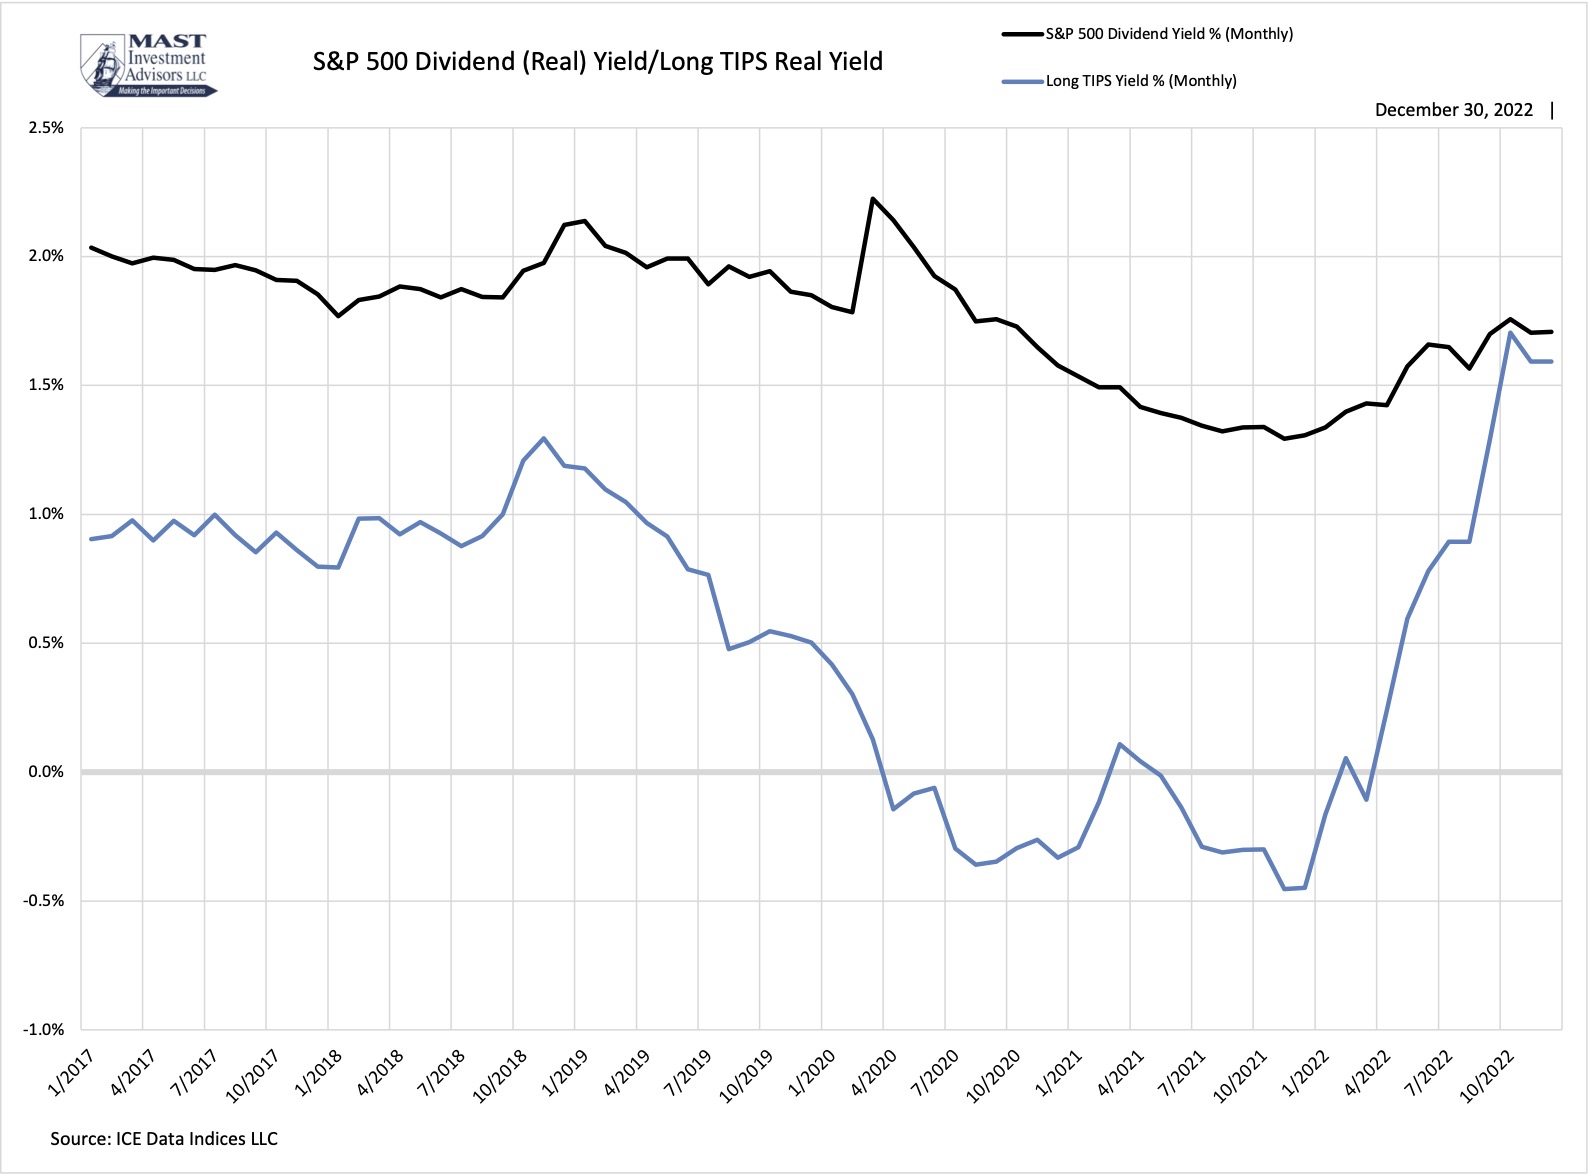
Fixed-income yield is a lower-risk income alternative to equities. Although not guaranteed, many equities provide dividend yield, that has the potential to increase or decrease. Over the past decade equity dividends have increased at above-average rates (due in part to fixed-income yield repression and corporate borrowing to increase both dividends and buybacks). Investors consider equities, and dividend yield, as a source of yield return. The equity dividend yield is a real return because inflation is included in corporate earnings through product and service price increases (or decreases). The graph displays the five year comparison of S&P 500 Index dividend yield compared to the long-TIPS yield and its attractiveness.
The equity dividend yield is the annual dollar amount of dividend distributions divided by the equity price. It is expressed as a percentage of the price. Because the dividend distribution is made from already realized earnings, it is a real yield. Price changes of company goods and services are already included in the earnings, so that price rate of change (up or down, inflation or deflation) is already accounted for in the earnings before the dividend distribution. Because the equity dividend is a real yield it should be compared to the real return of other assets, such as U.S. Treasuries.
U.S. Treasuries are the risk-free benchmark asset class. Because equities are long-term investment assets, their expected returns and yields should be compared to long-term maturity Treasuries. Further Treasury real yield should be compared to equity dividend yield because that yield is also real. The S&P 500 Index Dividend Yield / TIPS Yield Comparison chart shows the levels of yield between the S&P 500 Index and the 30-year TIPS Treasury bond. This compares the yield of the riskier equity asset class to the yield of the risk-free Treasury. Over most periods of time, equity dividend yield increases but it can, and does, decrease as well, particularly during recessionary periods.
Week 12/30/22
S&P 500 Index Dividend %
Long TIPS Yield %
Current
1.77%
1.67%
Historical Median Yield %
2.91%
2.65%
NOT DISPLAYED

Week 12/30/22
High Yield Index
Investment Grade Index
Long Treasury Bond
Bond/Index
7.56%
4.36%
2.98%
Yield %
8.83%
5.48%
3.97%
Median Yield%
7.70%
4.33%
5.65%
Credit Spread %
4.79%
1.38%
0.00%
Median-Credit Spread %
4.91%
1.38%
0.00%
Investment-Grade Bond Index Yield / Spread
This graph represents the yield ICE BofA US Corporate Index, which tracks the performance of US dollar denominated investment grade rated corporate debt publicly issued in the US domestic market. To qualify for inclusion in the index, securities must have an investment grade rating (based on an average of Moody's, S&P, and Fitch) and an investment grade rated country of risk (based on an average of Moody's, S&P, and Fitch foreign currency long term sovereign debt ratings). Each security must have greater than 1 year of remaining maturity, a fixed coupon schedule, and a minimum amount outstanding of $250 million. Original issue zero coupon bonds, "global" securities (debt issued simultaneously in the eurobond and USdomestic bond markets), 144a securities and pay-in-kind securities, including toggle notes, qualify for inclusion in the Index. Callable perpetual securities qualify provided they are at least one year from the first call date. Fixed-to-floating rate securities also qualify provided they are callable within the fixed rate period and are at least one year from the last call prior to the date the bond transitions from a fixed to a floating rate security. DRD-eligible and defaulted securities are excluded from the Index.
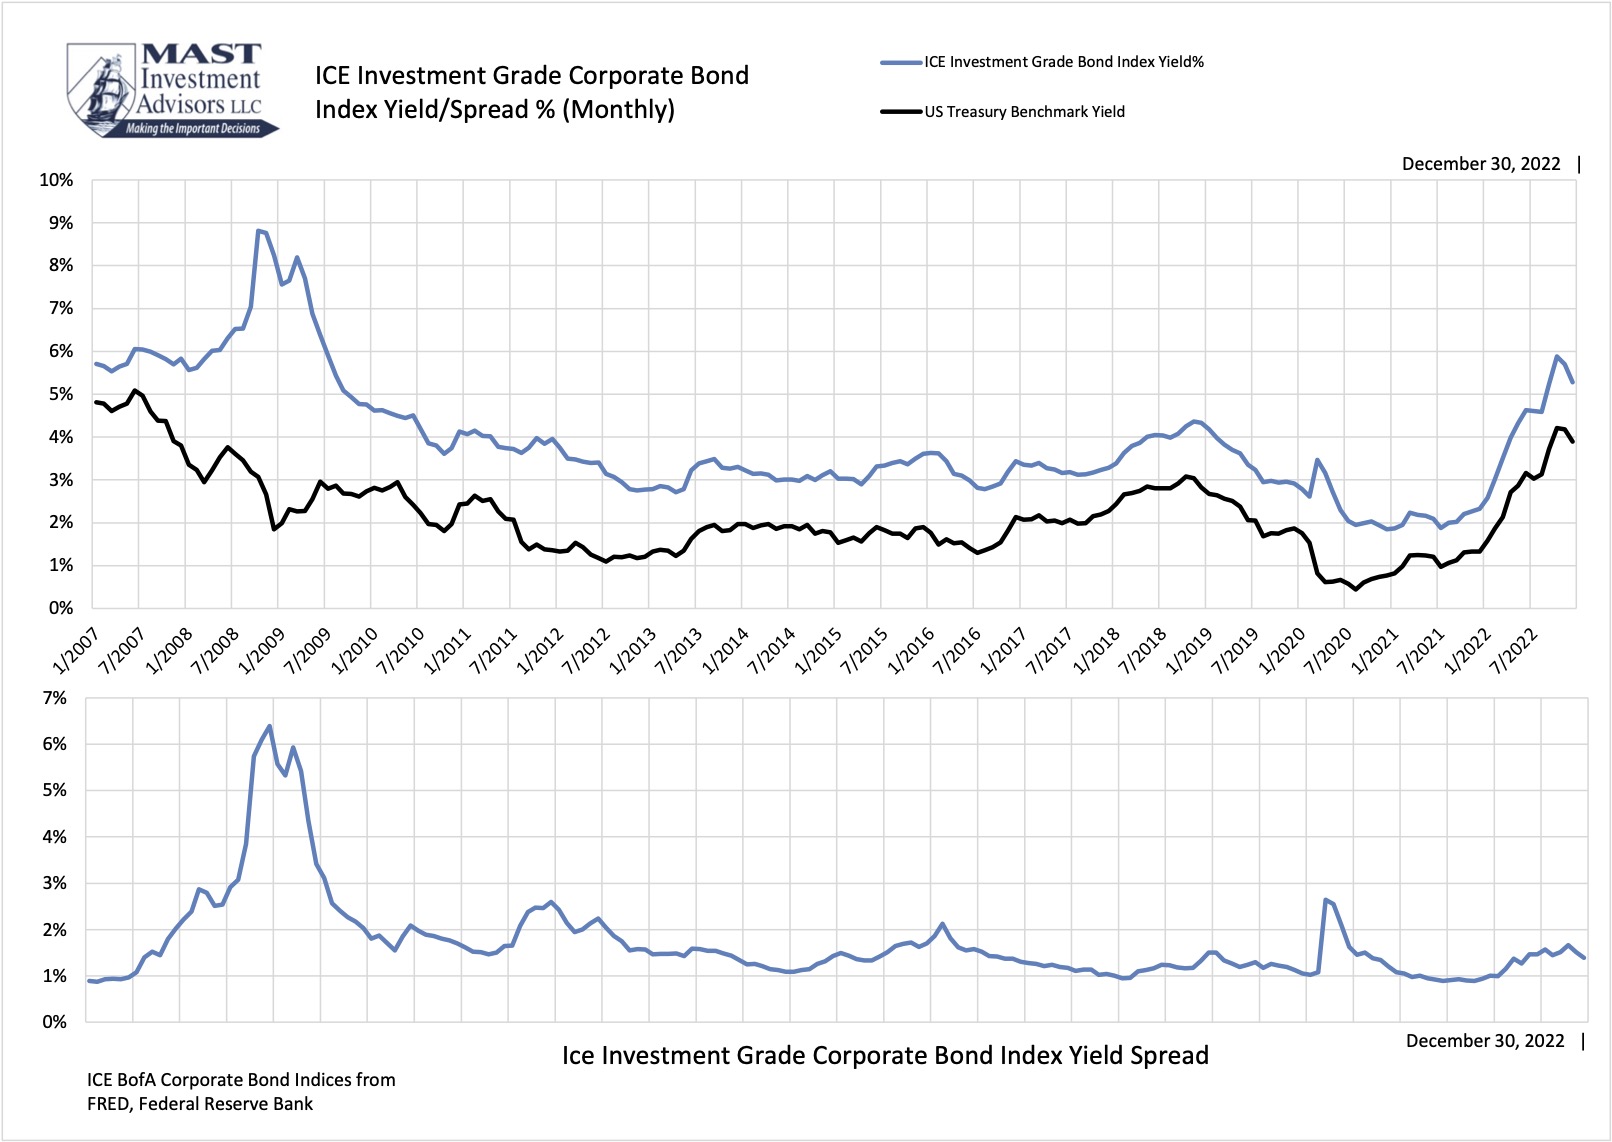
Week 12/30/22
Yield%
Spread%
Current
5.48%
1.38%
Historical Median
4.61%
1.38%
High-Yield Bond Index Yield / Spread
This graph represents the effective yield of the ICE BofA US High Yield Index, which tracks the performance of US dollar denominated below investment grade rated corporate debt publicly issued in the US domestic market. To qualify for inclusion in the index, securities must have a below investment grade rating (based on an average of Moody's, S&P, and Fitch) and an investment grade rated country of risk (based on an average of Moody's, S&P, and Fitch foreign currency long term sovereign debt ratings). Each security must have greater than 1 year of remaining maturity, a fixed coupon schedule, and a minimum amount outstanding of $100 million. Original issue zero coupon bonds, "global" securities (debt issued simultaneously in the eurobond and US domestic bond markets), 144a securities and pay-in-kind securities, including toggle notes, qualify for inclusion in the Index. Callable perpetual securities qualify provided they are at least one year from the first call date. Fixed-to-floating rate securities also qualify provided they are callable within the fixed rate period and are at least one year from the last call prior to the date the bond transitions from a fixed to a floating rate security. DRD-eligible and defaulted securities are excluded from the Index.
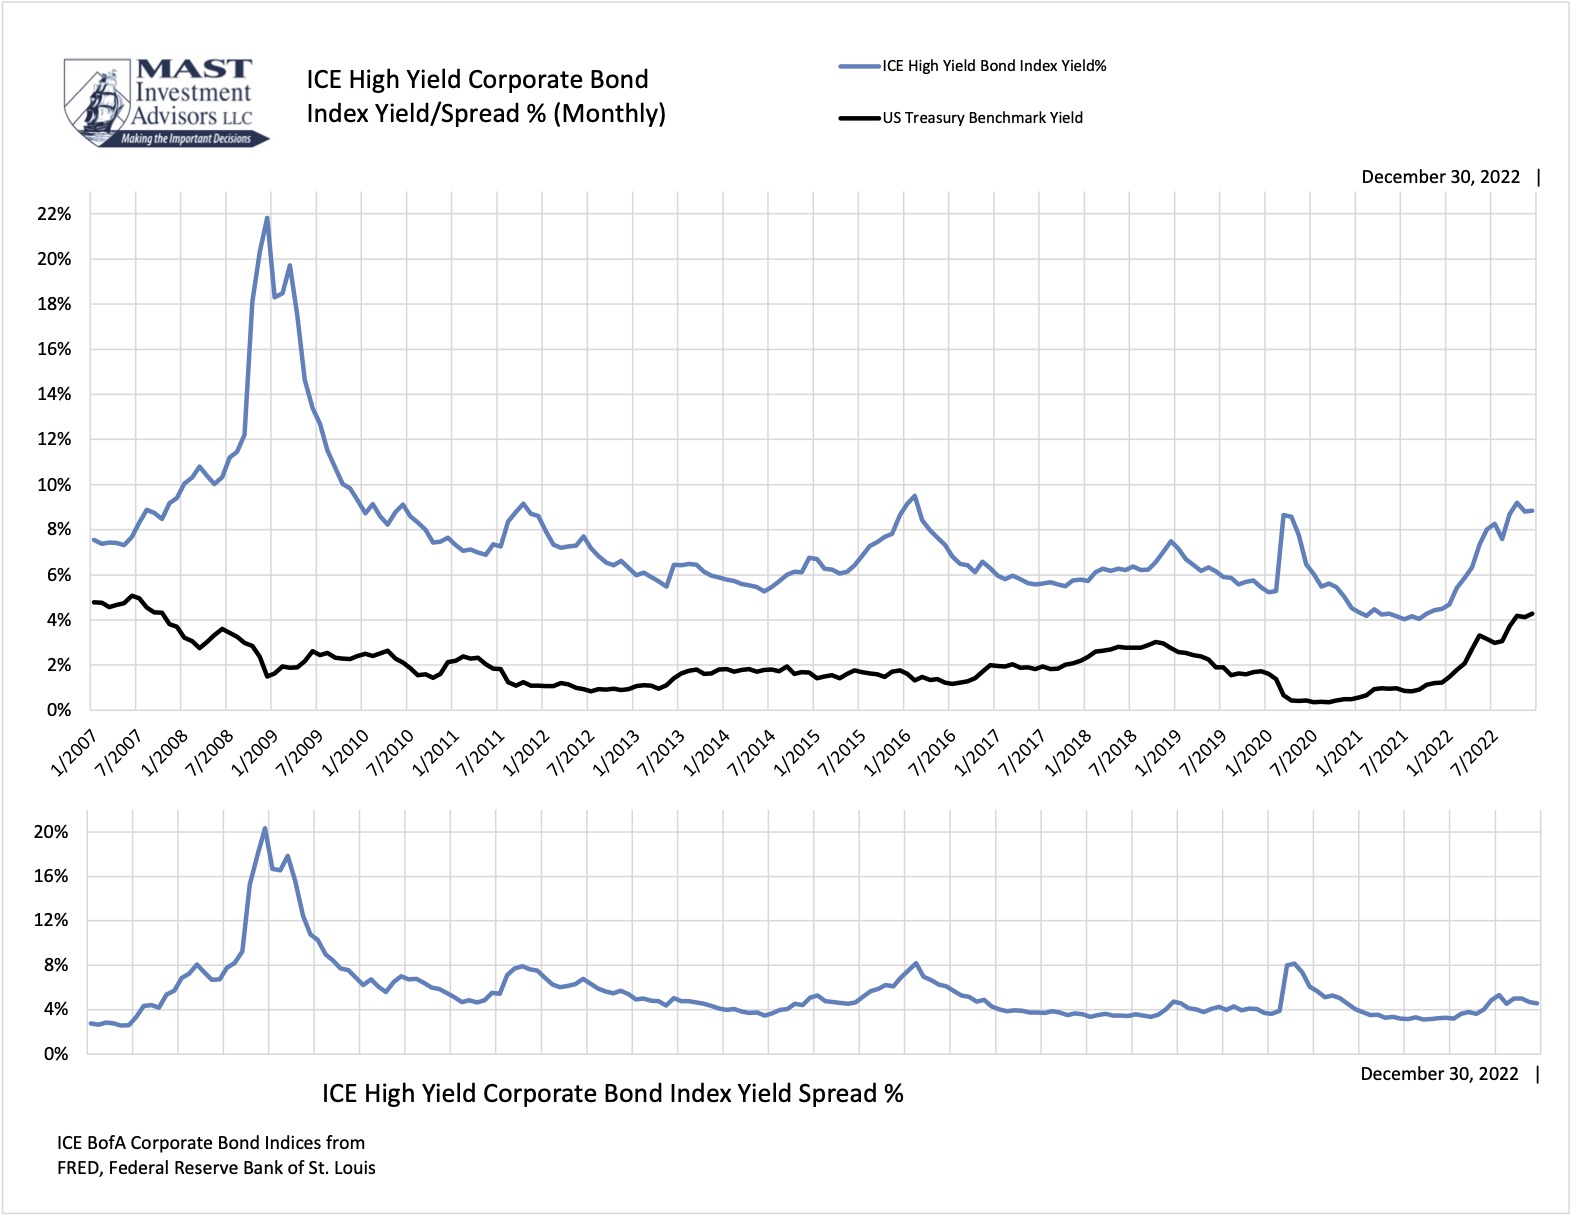
Week 12/30/22
Yield%
Spread%
Current
8.83%
4.79%
Historical Median
7.70%
4.91%
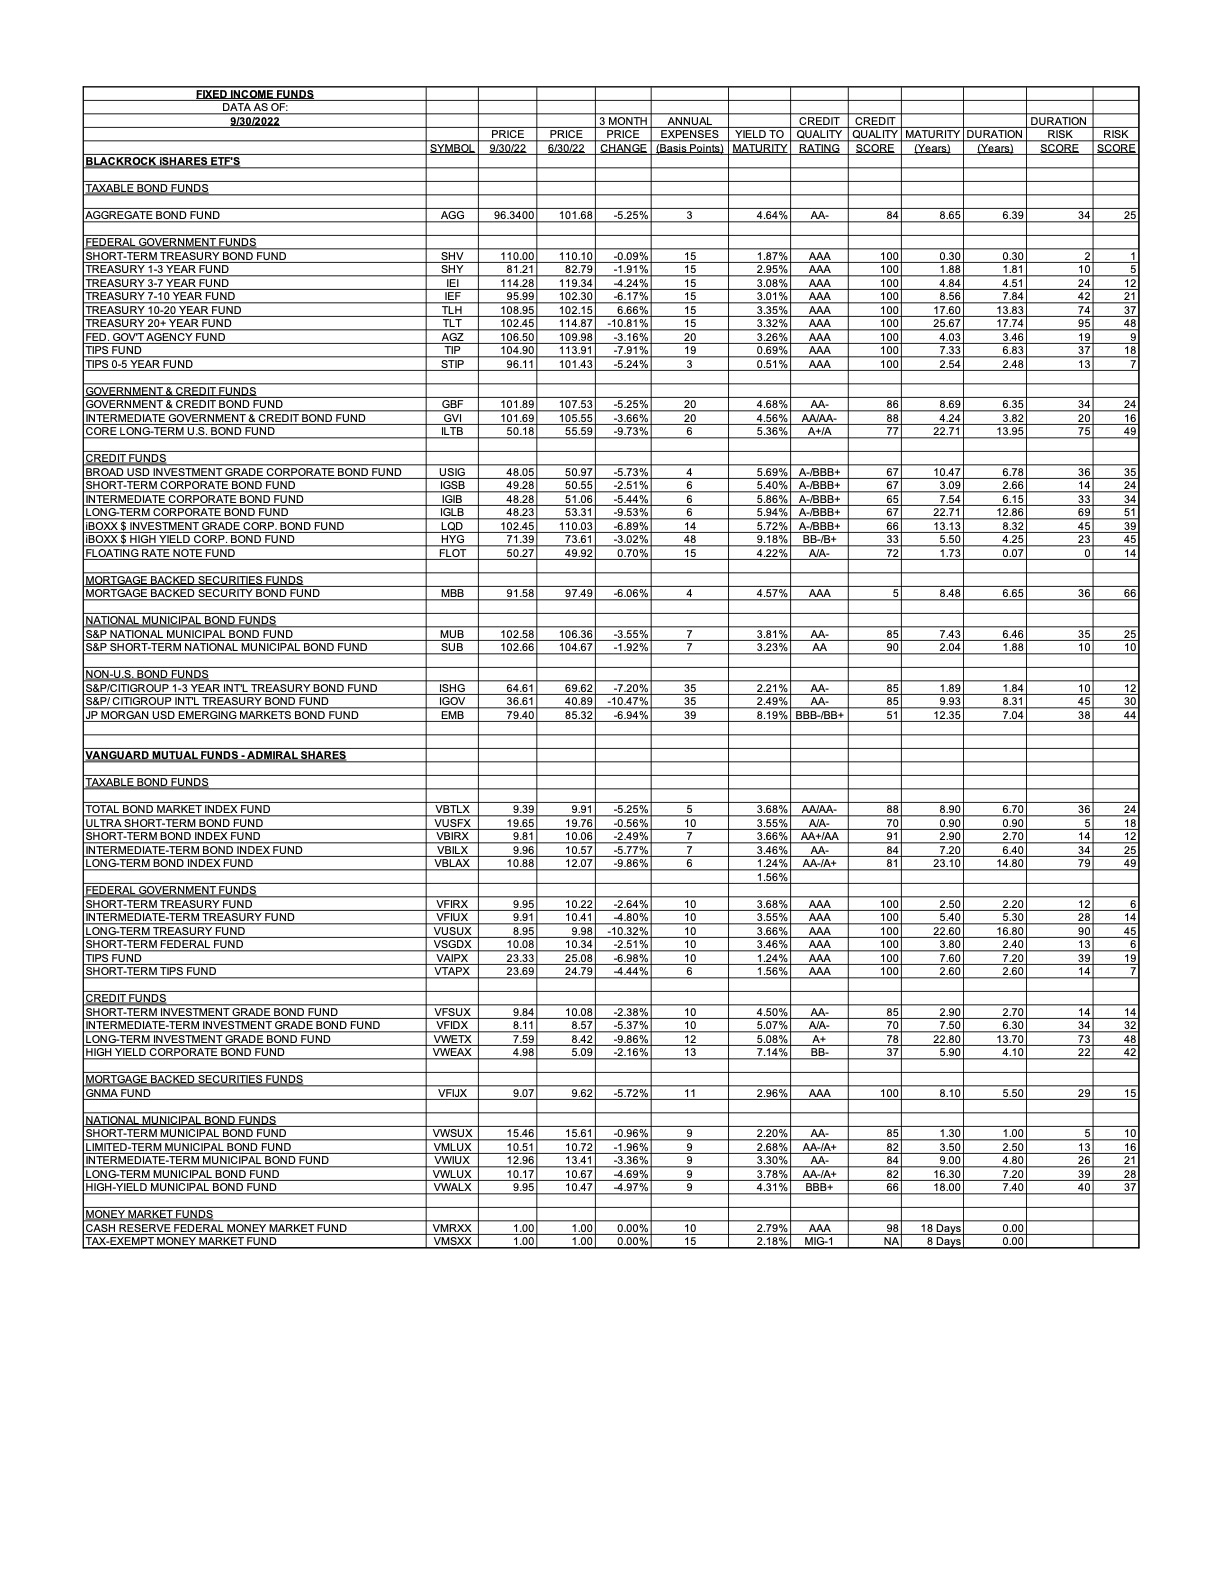
Bond Indexes / Funds Analysis Summary
Fixed income index exchange-traded and mutual funds are diversified, targeted and cost-effective securities to meet fixed income investment objectives. Objectives relate to credit (Treasury, Investment Grade and High Yield) and duration (expected date of principal return) risks and expected returns (yield to maturity). In order to provide a representative population of objective-targeted funds, below are market-traded funds and their critical factors for selecting funds for portfolio allocation.
This information is updated quarterly. Annual expenses are in basis points. 15 basis points is 0.15%. Yield to maturity is the total return of interest income, maturity principal at the stated date of maturity of the bonds in the fund. Credit quality are the safety ratings of all the bonds combined provided by the rating firms (see previous Investment Grade and High Yield Indexes). The higher the credit rating the higher the credit quality score (100 is the highest and 51 is the lowest).
Maturity is the stated date for bonds return of principal. Duration takes into account bond calls (early redemption allowances) which are likely to occur. The longer the duration, the higher the risk of interest rate change on the price of the bond. The lower the duration risk, the lower the duration risk score. The higher the duration risk, the higher the duration risk score. Scores range from 2 to 85.
The overall risk scores (from lowest risk to higher risk) range from 1 to 50. Based on measurements of decision criteria among fixed income credit and duration indexes, we recommend fixed income funds for portfolio allocation.
Week 09/30/22
Short Term 1-3 Year Treasury Fund
Fund 2
Fund 3
Fund 4
Yield to Maturity
2.95%
data
data
data
Credit Quality
AAA
data
data
data
Duration Years
1.81
data
data
data
Credit/Risk Score
100
data
data
data
Duration/Risk Score
10
data
data
data
Short term Treasuries provide yields superior to cash/money market funds with superior credit safety and liquidity. One-year Treasury yield 4.5% is the highest yield on this lowest-risk duration and credit since October 2007.