EQUITY DECISION CRITERIA
Following are updated/current decision criteria data and information to use for making investment asset allocation decisions. All of this information is market-based, already realized market price, information and relationships. There are no forecasts.
Long term expectations are generally five years or more into the future. Price behavior analysis (channel) captures the short-term trading ranges of price and ratio data. Trend direction and possible price-reversals are measured. The attractiveness of this information is recommended for strategic (long-term) and tactical (short-term) asset allocation decisions. The asset allocation decision has the greatest influence on portfolio returns, much more so than intra-index equity decisions: sector, size, style or individual stock.
This critical information is updated weekly (tables under each graph) and monthly (graphs). Mast expected return information is a balanced, risk-adjusted system, accurately and consistently calculated and replicated each period, to provide investors anchor positioning related to changing data, information, stories, themes and opinions. Single data information and appealing recent news and themes are transitory. Make the important decisions with market-based investor expectations.
Long Maturity TIPS Yield
Treasury Inflation Protected Securities, or TIPS, provide investors with a way to protect their investment from the impact of inflation. This protection is accomplished by linking interest paid and the principal returned to investors at maturity on TIPS to the Consumer Price Index. Yields on TIPS are real yields, that is, they are adjusted for inflation. As with all securities issued by the U.S. Treasury, TIPS effectively have no credit risk. TIPS are issued with maturities of 5, 10, and 30 years.
The long Treasury Inflation Protection (TIP) bond provides a payment equal to the CPI (inflation) rate as an increase in the principal maturity value. It also provides a stated interest coupon rate. Depending on the current market price of the bond, the TIP yield is the real yield of the bond because the inflation payment is reflected in the principal value. Because the adjusted principal and coupon rate are guaranteed by the U.S. Treasury, the TIP yield is the long-term, real, risk-free expected return. It is market-based and valued in market transactions daily. Among investment alternatives, investors who require complete safety (risk-free) real rate of return for the long-term can invest in this security. To achieve higher rates of return generally involves the assumption of higher levels of risk. The TIP yield is a critical benchmark to measure relative risk and return opportunity and against which to compare rates of return of riskier investments. Comparison of the TIP yield to 1) past yield levels and 2) current trending yield levels gives insight into prevailing economic conditions, trends and influence on riskier asset relative returns.
The assessment of all risky financial asset classes needs to include comparing their expected rates of return to those on risk-free assets. U.S. Treasuries are the largest and most liquid risk-free asset class. Yields on long maturity (30-year) TIPS are used to assess U.S. stocks. Subtracting the long-TIPS yield from the expected real rate of return on the S&P 500 results in an estimate of the expected equity risk premium. This is a critical measure used to assess the relative attractiveness of U.S. stocks to long maturity U.S. Treasury securities.
The accompanying chart provides yields on long maturity TIPS over the past five years. Also provided are estimates of trend levels of those yields and the variability of yields around the estimated trend. This information is used to assess where long TIPS yields might be heading.

Week
12/30/22
Current % Yield
1.666%
Estimated % Yield
1.796%
Channel Percentile
33.7%
Trend
Rising Faster
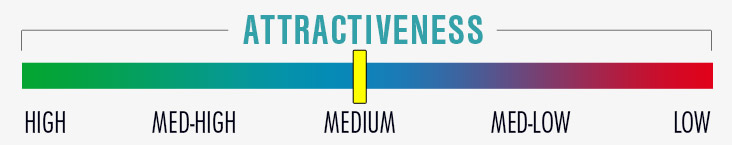
Long TIPS Yield Remains Unattractive
Long TIPS yield is in the bottomhelf of its channel and rising. The increase in the yield since an historical low in 2021 provides risk-free return competition for riskier asset classes.
SP500 Index Channel Graph
The S&P 500 Index price fluctuates within a trading range which we measure from a channel range. Capturing over 95% of the expected trading range, the current price is identified in relation to the middle of the channel (estimated level at 50%), the bottom of the channel (0% or below 0%) or the top of the channel (100% or above 100%). Generally, a channel position in the bottom quartile of the channel (below 0% up to 25%) is a good price at which to add equity. A channel position at the top quartile of the channel (75% up 100% and above) is a good price at which to reduce equity. These ranges indicate the attractiveness of equities based on Channel criteria.
Channel Analysis provides at statistical way to measure both trends in a time series and the degree to which the current reading differs from it estimated trend level. In effect, it measures both trend or momentum and a potential reversal to trend or mean. It provides useful tactical measures to assess current conditions of a time series and to provide some insight into where a time series might be headed.
Channel analysis is statistical regression analysis in which time is the independent variable and the measure being analyzed is the dependent variable. Time is used to estimate a current value of the measure being analyzed, based on past known information. Importantly, the current estimated value of a measure is different from its mean value, even though past values of a measure are used to compute both.
Regression analysis captures the trend in a measure over some past period of time, whereas the mean only measures its central tendency. With many time series, trend provides more insight than central tendency. Yet moving averages are almost universally used, because they are traditional, easy to calculate, and simpler than regression analysis. But those characteristics of means do not make them as useful as or provide more insights than estimated trend levels. Statistics associated with regression analysis enable one to measure the degree to which readings on a variable have varied from estimated levels, or the standard error of the estimate.
Two standard errors of the estimate are used to establish a channel around the estimated level. These are expressed with two standard errors above the estimated level being the 100th percentile and two standard errors below the estimated being the zero percentile. The estimated level is assigned to be the 50th percentile. Channel percentile readings greater than 100, or above top of channel readings, and negative channel percentile readings, or below bottom of channel readings, are rare and extreme.
Channel analysis essentially measures where the level of something, such as the S&P 500 Index, is at any point in time and provides a standardized measure of how much its current reading differs from its current estimated level. Prior rates of change in estimated levels are used to measure momentum and to identify inflection points in estimates. This information is useful for deciding when and at what levels to make buy or sell decisions and to make asset allocation changes in investment portfolios.
Following is a five year channel of the S&P 500 Index as a reference for our weekly reports which include most recent price channel position, estimated price, channel top, channel bottom and channel percentile compared to estimate.

Week
12/30/22
Index Price
3839.5
Estimated Price
3720.82
Channel Percentile
67.5%
Trend
Rising Faster
S&P 500 Index is trading higher in its channel and is less attractive for additional equity investment.
Normalized Operating Earnings Per Share
Trailing operating earnings of the S&P 500 and normalized earnings per share are displayed. Current earnings which are above or below normalized earnings coincide with changes in economic growth, increasing or decreasing S&P 500 Index prices and increasing or decreasing investors' expected returns. Generally, when operating earnings are near 20% above normalized earnings, subsequent earnings growth tends to decelerate.
An estimate of normalized earnings per share is based on the prior 10 years of S&P 500 Index operating earnings per share. This estimate of normalized earnings is then divided by the S&P 500 Index (price) to compute the expected real long-term rate of return for stocks. As with all Mast expected return analysis, it is based on already realized index earnings, not forecasted earnings. Using ten years of past, realized earnings data is less variable than shorter, 12-month trailing operating earnings per share. The five year graph below compares normalized operating earnings per share with 12-month trailing operating earnings per share. Along with economic and financial market cycles, one-year operating earnings per share differ as a percentage above or below normalized earnings per share. This indicates periods of time when actual earnings per share are accelerating or decelerating around (both above and below) normalized earnings per share.

Week
12/30/22
Operating EPS Trailing
200.12
Operating EPS Trailing P/E
19.19X
Normalized Operating EPS
183.56
Normalized EPS Trailing P/E
20.92X
Operating EPS %+/- Normalized EPS
9.02%
Earnings growth is decelerating and current operating earnings exceed normalized by 9%. Earnings are no longer a support for increasing equity prices.
Expected Equity Real Return %
For stocks, the method used to estimate the expected real long-term rate of return is a ratio of current earnings per share to market price. A broad, well diversified, and widely known and used stock index with abundant historical information is needed. The S&P 500 Index best meets these criteria. Specifically, an estimate of normalized operating earnings per share, based on the prior 10 years of earnings, is used. This estimate of normalized earnings is then divided by the S&P 500 Index (price) to compute the expected real long-term rate of return for stocks.
To compute the expected long-term equity risk premium, an expected real long-term rate of return for stocks and an expected real long-term rate of return for long-term Treasury bonds are needed. The expected real rate of return on long-term Treasury bonds is the prevailing yield on long maturity Treasury Inflation Protected Securities, or TIPS. The expected equity risk premium is the difference between the two. Importantly, these expected real rates of return must reflect the collective expectations of investors, and this can only be provided by market prices. One's own opinion or estimates provided from surveys of "experts" are not used. What is important is what markets think and expect, because it reflects the collective expectations of investors. The expected long-term equity risk premium measures the additional rate of return that financial markets expect and require from stocks to compensate for the higher risk of stocks compared to long-term Treasury bonds.
Although not widely used by investors, and seldom discussed in the financial media, the expected long-term equity risk premium is the proper and best metric for assessing the investment attractiveness of stocks in relation to long-term Treasury bonds. Assessing stocks and long-term Treasury bonds independently is not the way investors behave. Investors compare the relative attractiveness among several asset classes. The comparison between stocks and long-term Treasury bonds is best measured by the expected long-term equity risk premium, not by looking only at price/earnings ratios, which is the stock valuation measure used by the overwhelming majority of investors.
The graphs below depict the components of the expected long-term equity risk premium using monthly prices for the past five years. The first graph is the expected long-term equity risk premium. The second graph is the yield (real return) for the long maturity Treasury Inflation Protected Securities, or TIPS. The third graph, the long term expected equity risk premium, is the difference between the first graph (expected equity real return) and the second graph (long term TIPS yield).

Week
12/30/22
Expected Real Rate of Return (ERR)
4.19%
Long Term Median ERR
5.22%
Recent S&P 500 price increases continue to decrease the long-term expected real return. It remains well-below historical median 5.73%.
The SP500 Equity Risk Premium (ERP)
The expected long-term equity risk premium measures the additional rate of return that financial markets expect and require from stocks to compensate for the higher risk of stocks compared to long-term Treasury bonds.
To compute the expected long-term equity risk premium, an expected real long-term rate of return for stocks and an expected real long-term rate of return for long-term Treasury bonds are needed. The expected equity risk premium is the difference between the two. Importantly, these expected real rates of return must reflect the collective expectations of investors, and this can only be provided by market prices. One's own opinion or estimates provided from surveys of "experts" are not used. What is important is what markets think and expect, because it reflects the collective expectations of investors.
The expected real rate of return on long-term Treasury bonds is the prevailing yield on long maturity Treasury Inflation Protected Securities, or TIPS. For stocks, the method used to estimate the expected real long-term rate of return is a ratio of current earnings per share to market price. A broad, well diversified, and widely known and used stock index with abundant historical information is needed. The S&P 500 Index best meets these criteria. Specifically, an estimate of normalized operating earnings per share, based on the prior 10 years of earnings, is used. This estimate of normalized earnings is then divided by the S&P 500 Index (price) to compute the expected real long-term rate of return for stocks.
Although not widely used by investors, and seldom discussed in the financial media, the expected long-term equity risk premium is the proper and best metric for assessing the investment attractiveness of stocks in relation to long-term Treasury bonds. Assessing stocks and long-term Treasury bonds independently is not the way investors behave. Investors compare the relative attractiveness among several asset classes. The comparison between stocks and long-term Treasury bonds is best measured by the expected long-term equity risk premium, not by looking only at price/earnings ratios, which is the stock valuation measure used by the overwhelming majority of investors.
Expected long-term equity risk premiums have varied over time. Based on monthly data from January 1958 through September 2018, the highest expected equity risk premium was 9.11% in August 1982, and the lowest was -1.43% in January 2000. The mean long-term expected equity risk premium over this period was 3.33%. From December 1958 through September 2018, the annualized real rate of return for the S&P 500 Index was 6.23%. The annualized real rate of return for 30-year Treasuries was 2.90%. The difference was 3.33%. This is not a coincidence. Market expectations based on market prices are invaluable measures of long-term rates of return on financial assets.
Varying the asset allocation in portfolios between stocks and long-term bonds based on the expected long-term equity risk premium is a superior approach and methodology. Mast uses this measurement as the first criterion, among several, for the allocation of client investment portfolios to stock, bond and cash assets. Related to portfolio liquidity need (now, later, never) more or less risk is acceptable. Regardless of liquidity need, when the risk premium achieves substantial above/below average readings, comparative better returns for either stocks or bonds can change the asset allocation in that favor. Viewing the long term history of the equity risk premium illustrates that it changes slowly over time and achieves and sustains intermediate periods of narrow range. It also adjusts to extremes in relative valuation and return, both high and low.

Week
12/30/22
Equity Risk Premium (ERP)
2.527%
Estimated ERP
2.523%
Channel Percentile
59.3%
Trend
Falling Faster
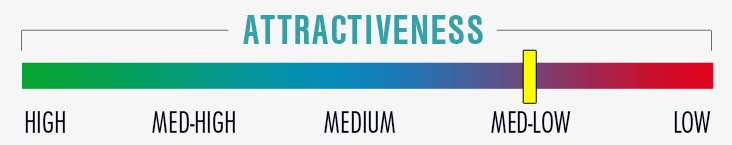
The equity risk premium remains below 3.00% and below its long-term median. It is falling faster and is unattractive.

Week
12/30/22
Equity Risk Premium (ERP)
2.527%
Estimated ERP
2.523%
Channel Percentile
59.3%
Trend
Falling Faster
The ERP is near its estimate and falling faster. It is too low for prevailing conditions.
S&P 500 Valuation Model
The estimated fair value of U.S. stocks is based on the Standard and Poor’s 500 Index. Conceptually, the price of an investment is the present value of expected future cash flows. This requires estimates of those future cash flows and a rate at which they are discounted to the present. Specifically and importantly one needs expectations for those cash flows and the discount rate that are reflected in market prices.
In the case of the S&P 500 Index, a ratio of earnings-to-price can be used as the expected real long-term rate of the return on that index. Known earnings can be and need to be used in calculating the earnings/price ratio. The earnings used are a measure of normalized operating earnings per share for the S&P 500.
For purposes of estimating a fair value for the S&P 500 Index, the way investors behave is required. Investors do not assess stocks in isolation, but how their expected real rates of returns compare to those of other investments. This simple but very important concept is not used in popular methods of valuing stocks, which tend to be based on price/earnings ratios and how they compare to historical averages.
In our estimate of the fair value of the S&P 500, expected real long-term rates of return, based on normalized earnings/price ratios, are compared to the market’s expected real rates of returns for a long maturity U.S. Treasury security. This is represented by yields on the long maturity Treasury Inflation Protected Security, or TIPS. The difference between expected real rates of return on the S&P 500 Index and long TIPS yields measures the additional real rate of return that markets expect and require from stocks over a long-term Treasury bond. This difference is referred to as the expected equity risk premium, and it is the single most important measure for evaluating stocks.
Expected equity risk premiums possess an important characteristic that expected real long-term rates of return and p/e ratios lack. Expected equity risk premiums display a tendency to revert, over time, towards historical normal levels. This important characteristic is used to make our estimated fair value for the S&P 500 Index.
Our estimates of the S&P 500’s fair value is simple and they intentionally use only known prices and operating earnings per share for the S&P and known yields on long TIPS. We do not use our forecasts and expectations, or those of experts, to estimate fair values for the S&P 500. This approach provides estimates of fair value for the S&P 500 Index that tend to be more reliable than estimates based on p/e ratios, which can differ so widely from current prices that it questions how useful they are.

Week
12/30/22
Current SP500 Index Price
3839.5
Estimated Fair Value Price
3720.4
Current %+/- Fair Value
3.20%
SP500 One Year Expected Return
0.88%
Equity Risk Premium (ERP) at Fair Value
2.532%
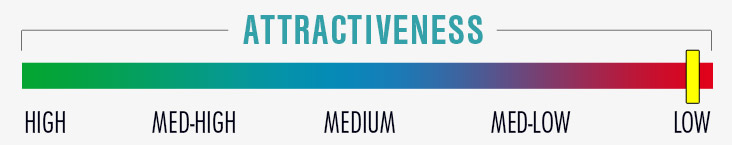
S&P 500 Index is slightly above fair value. The year ahead expected return is very low and unattractive for additional equity investment.